|
Notes: AM frequency response was fairly restricted due to the 4.8 kHz maximum i-f bandwidth. AM distortion numbers show the somewhat typical increase at lower audio frequencies - most often caused by the low audio frequencies riding on the AGC line. The audio response rolls off rather quickly on the low end. A frequency response test was run on just the audio output stage which confirmed the tiny audio output transformer to be responsible for the poor low frequency audio performance.
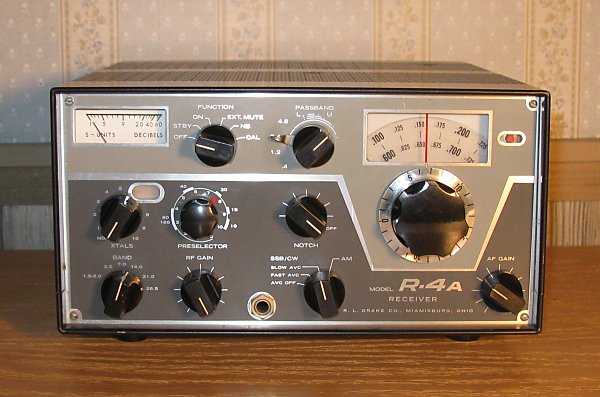
Note that this must have been a 'late' R-4A since the product detector, AM detector, agc and audio preamplifier stages are solid state as in the R-4B. Did not investigate why the AM distortion measurement results were so bad other than to verify all appropriate circuit components were in working order.
|
|