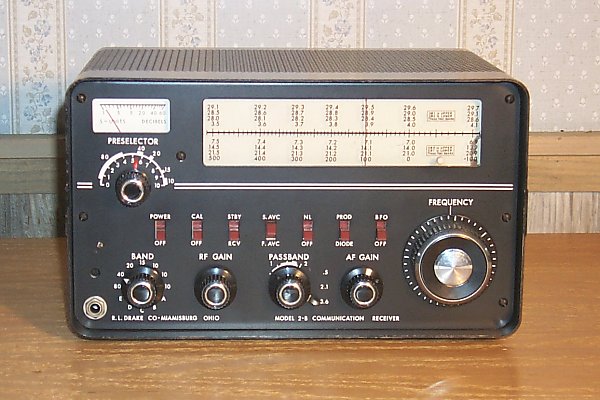
Drake 2-B Receiver Performance Test

Drake 2-B

Drake 2-B

Band MDS Blocking Two-tone D.R.
(20 kHz) (20 kHz)
 
80 meters -139 dBm 117 dB 83 dB
40 meters -140 dBm 118 dB 84 dB
20 meters -138 dBm 118 dB 87 dB

AM Audio S/N: 33 dB


AM Audio Frequency Response:

 
100 Hz 200 Hz 400 Hz 600 Hz 800 Hz 1 kHz 2 kHz 3 kHz 4 kHz 5 kHz 6 kHz
 
-16 dB -3 dB 0 dB 0 dB 0 dB 0 dB -5 dB -30 dB -36 dB -42 dB -

AM Audio Distortion:

 
Mod% 100 Hz 200 Hz 400 Hz 600 Hz 800 Hz 1 kHz 2 kHz
 
30% 63% 16% 5.6% 4.0% 3.5% 3.2% 4.5%
50% 71% 13% 5.0% 8.9% 11% 10% 5.0%
70% 56% 14% 13% 16% 18% 14% 5.0%
90% 63% 22% 18% 20% 20% 18% 5.0%
100% 63% 25% 20% 22% 22% 18% 5.0%

Notes: AM frequency response was fairly restricted due to the 3.6 kHz maximum i-f bandwidth. AM distortion numbers show the somewhat typical increase at lower audio frequencies - most often caused by the low audio frequencies riding on the AGC line. Also there is the usual increase in audio distortion as the modulation percentage increases. This is due to the detector's inability to cleanly demodulate the higher amplitude levels.

Did not have a chance to investigate why the distortion numbers were significantly worse than the Drake 2-A.